Dashboard and Metrics
Dashboard
The first page after signing in. It sums up the installation, or your tenant if you belong to one.
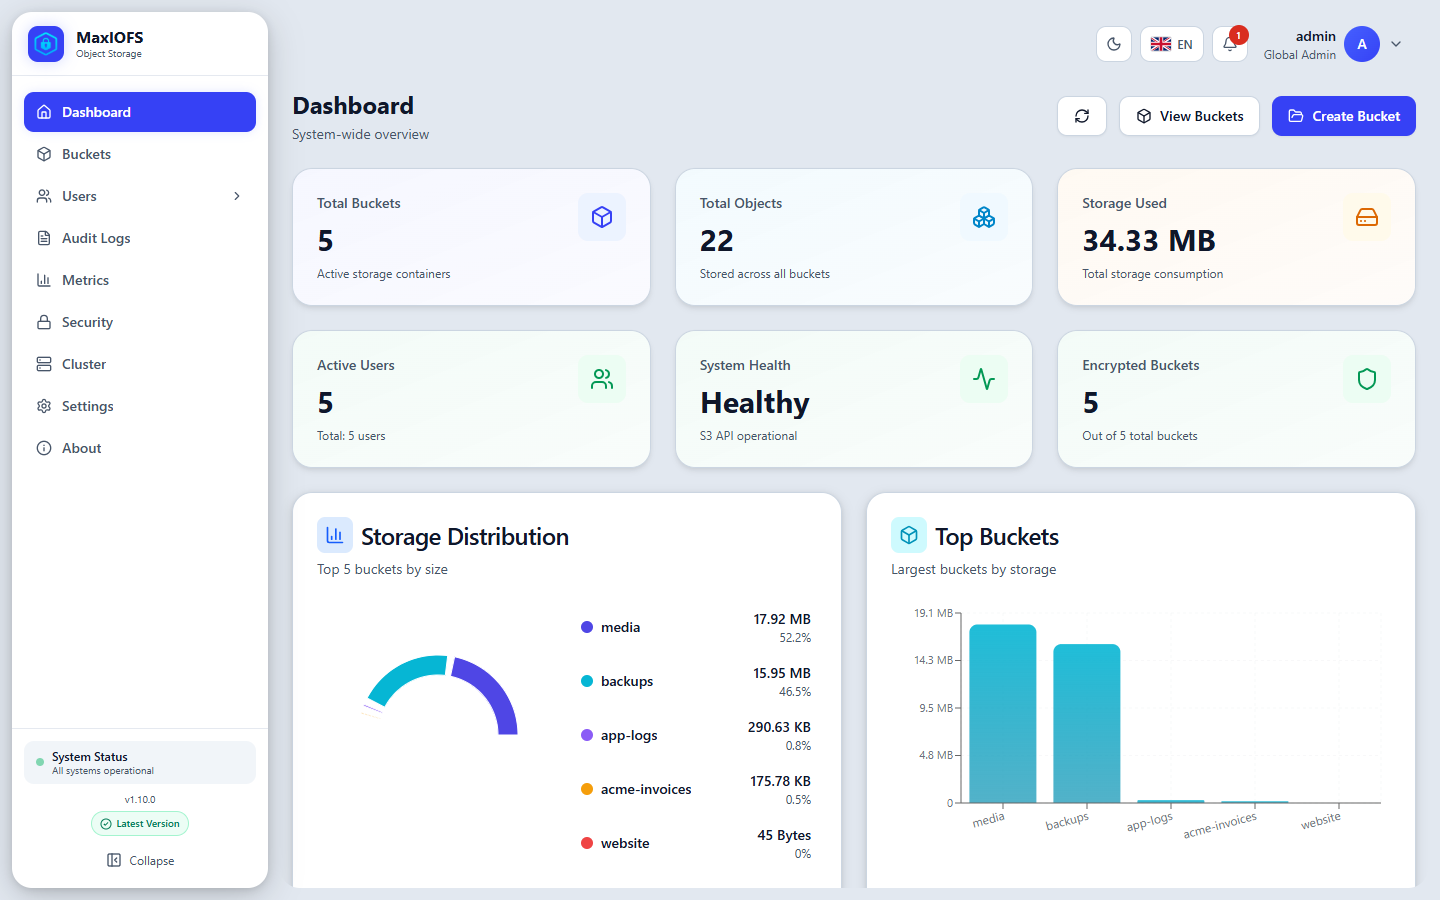
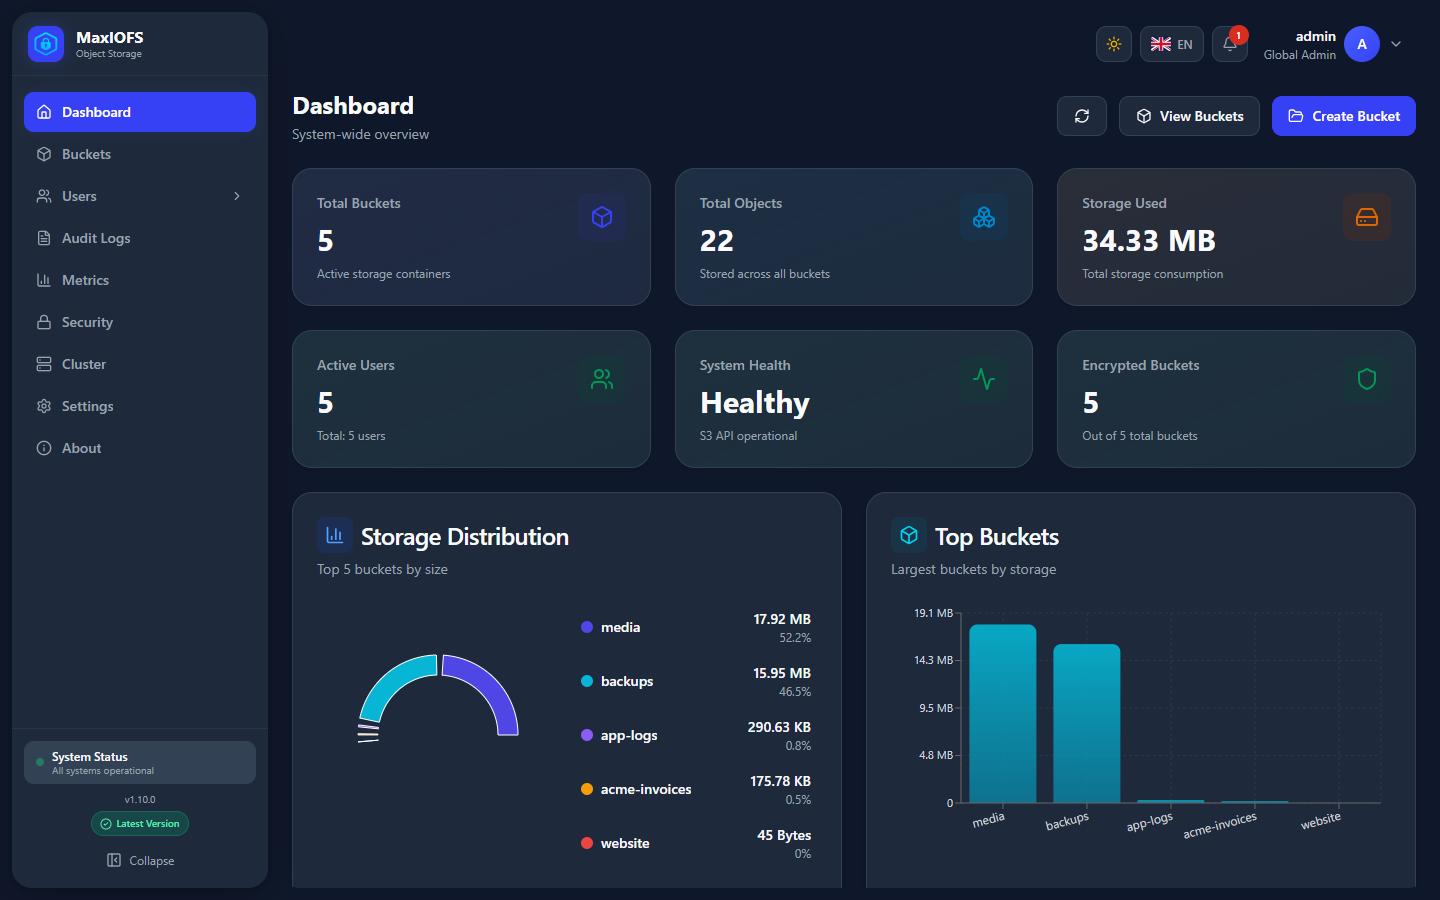
| Card | Shows |
|---|---|
| Total Buckets, Total Objects, Storage Used | What you can see, in numbers |
| Active Users | Accounts that are active, out of all |
| System Health | Whether the S3 API answers |
| Encrypted Buckets | Always all of them: encryption at rest is always on |
| Storage Distribution, Top Buckets | The five largest buckets |
Create Bucket and View Buckets are shortcuts; reloads the numbers.
Metrics
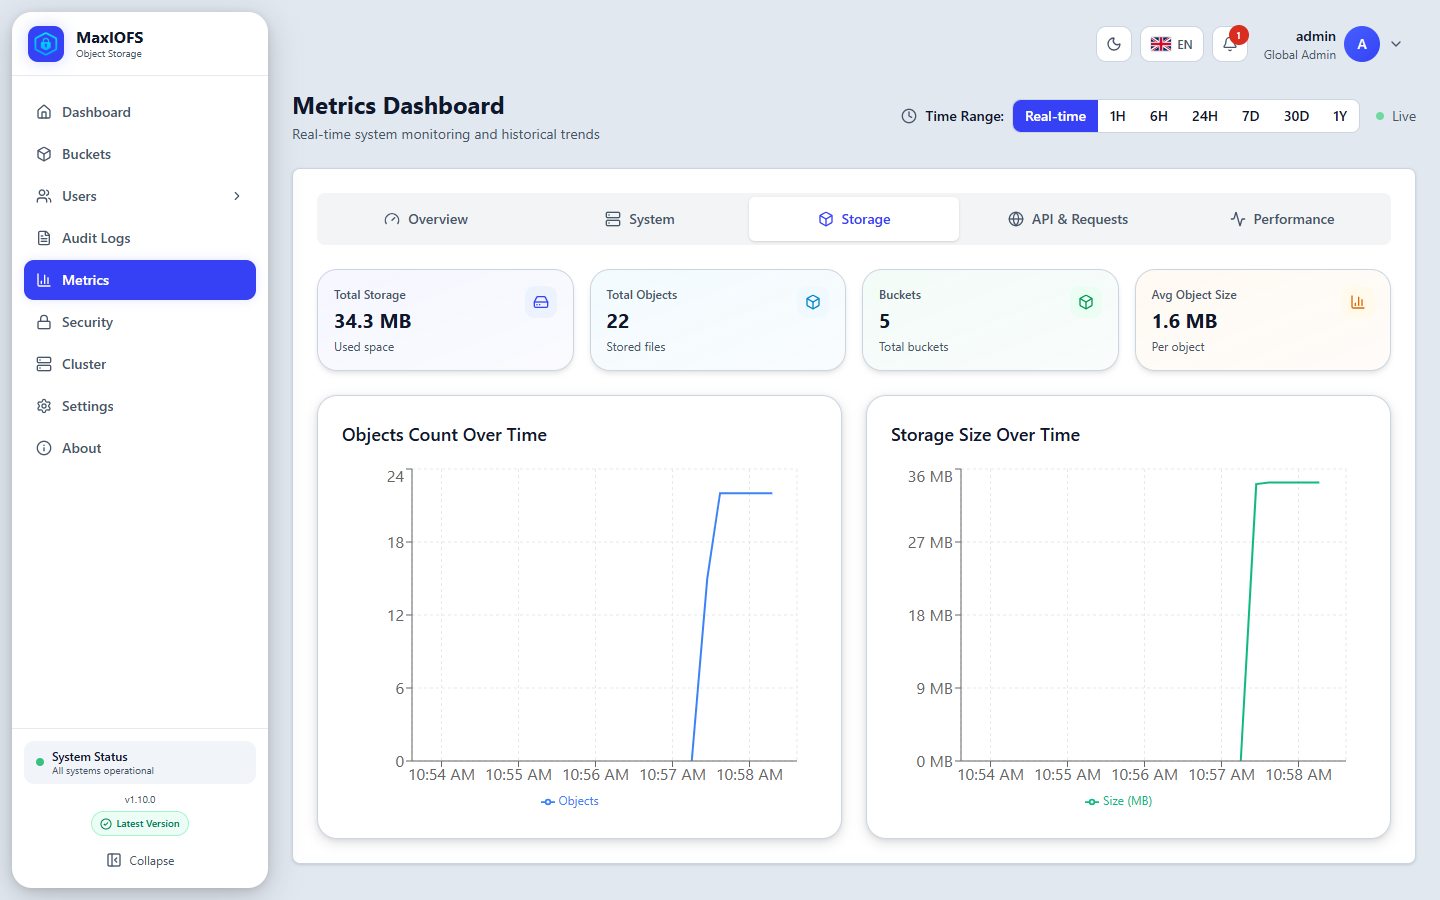
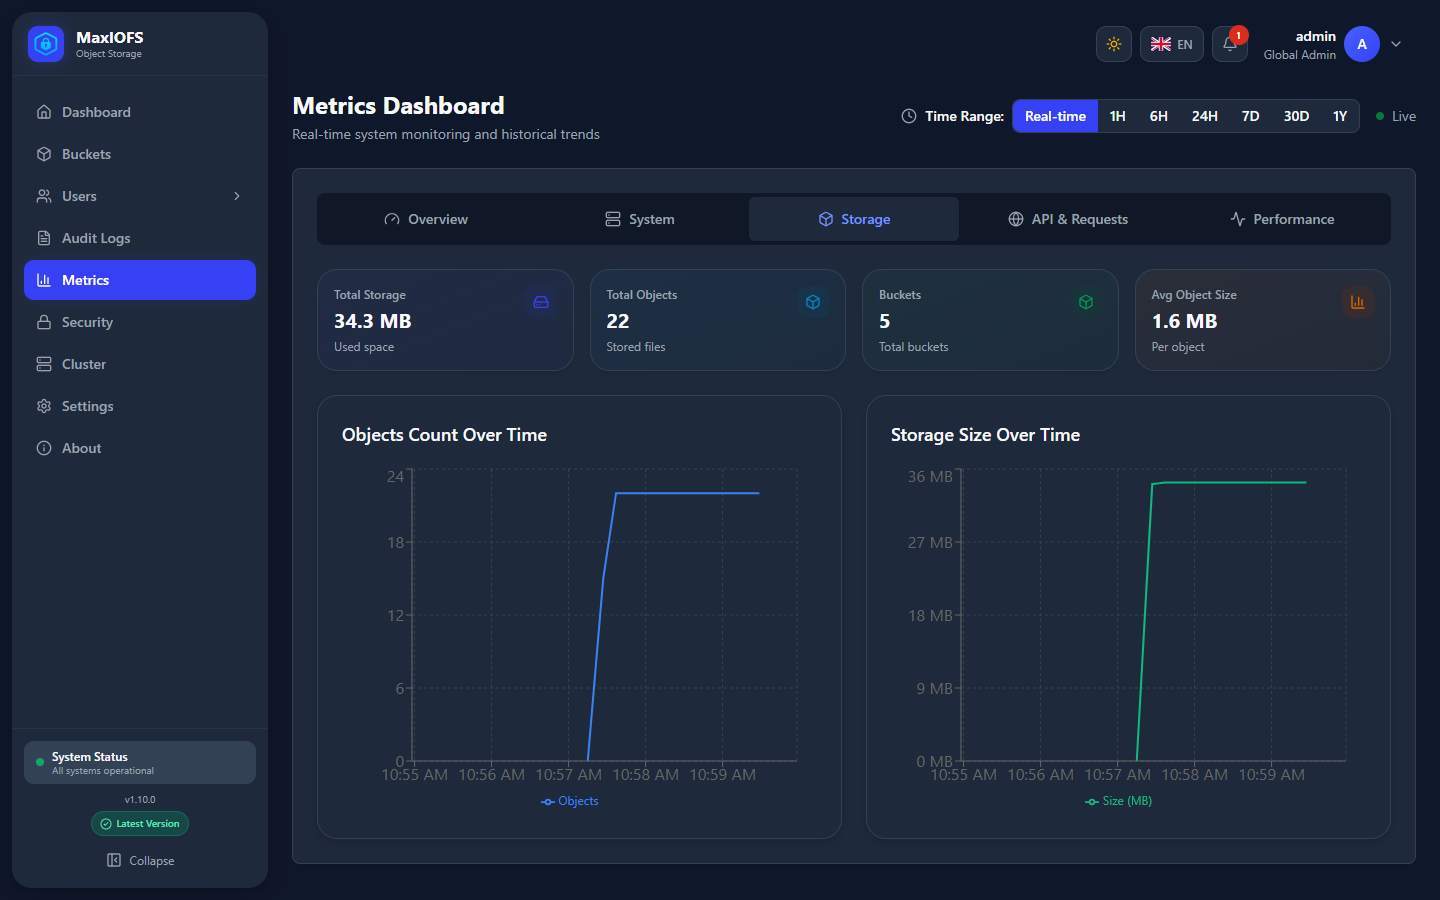
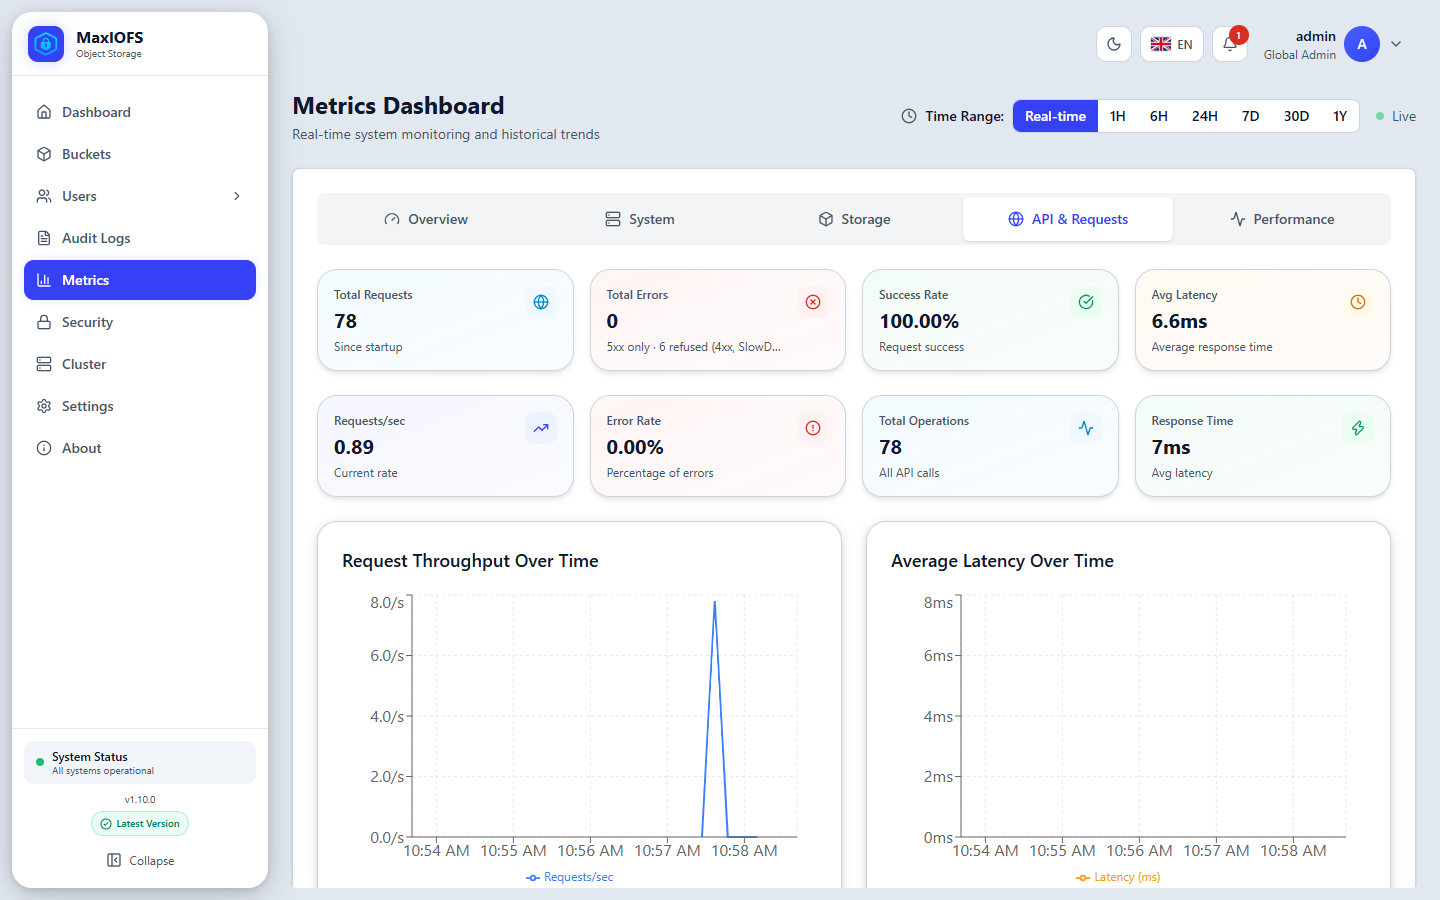
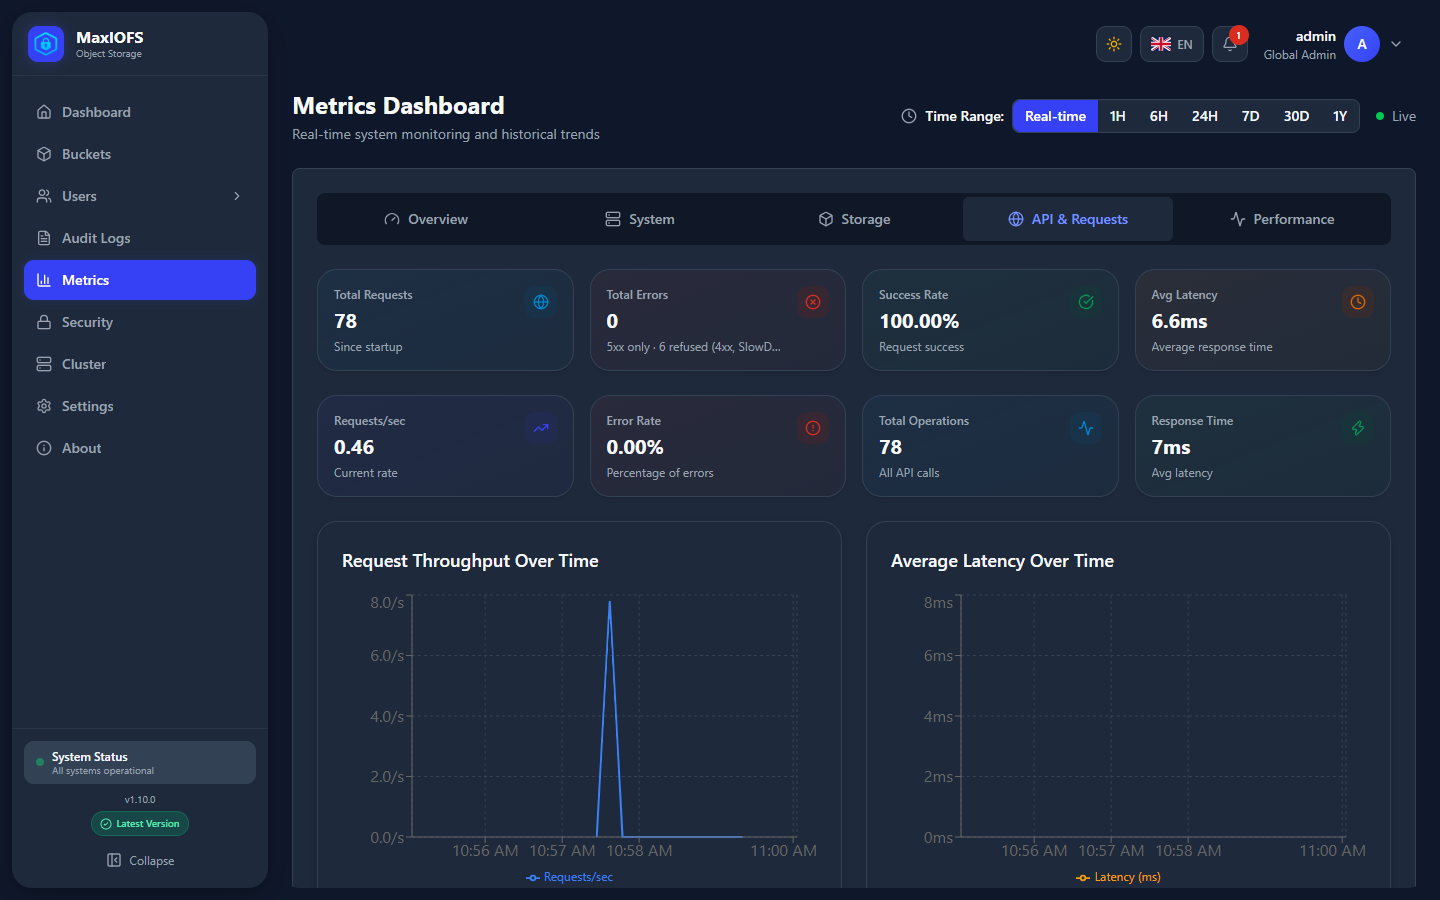
Metrics (global administrators) shows live and historical charts. Pick the time range at the top right: real time, or the last hour up to a year.
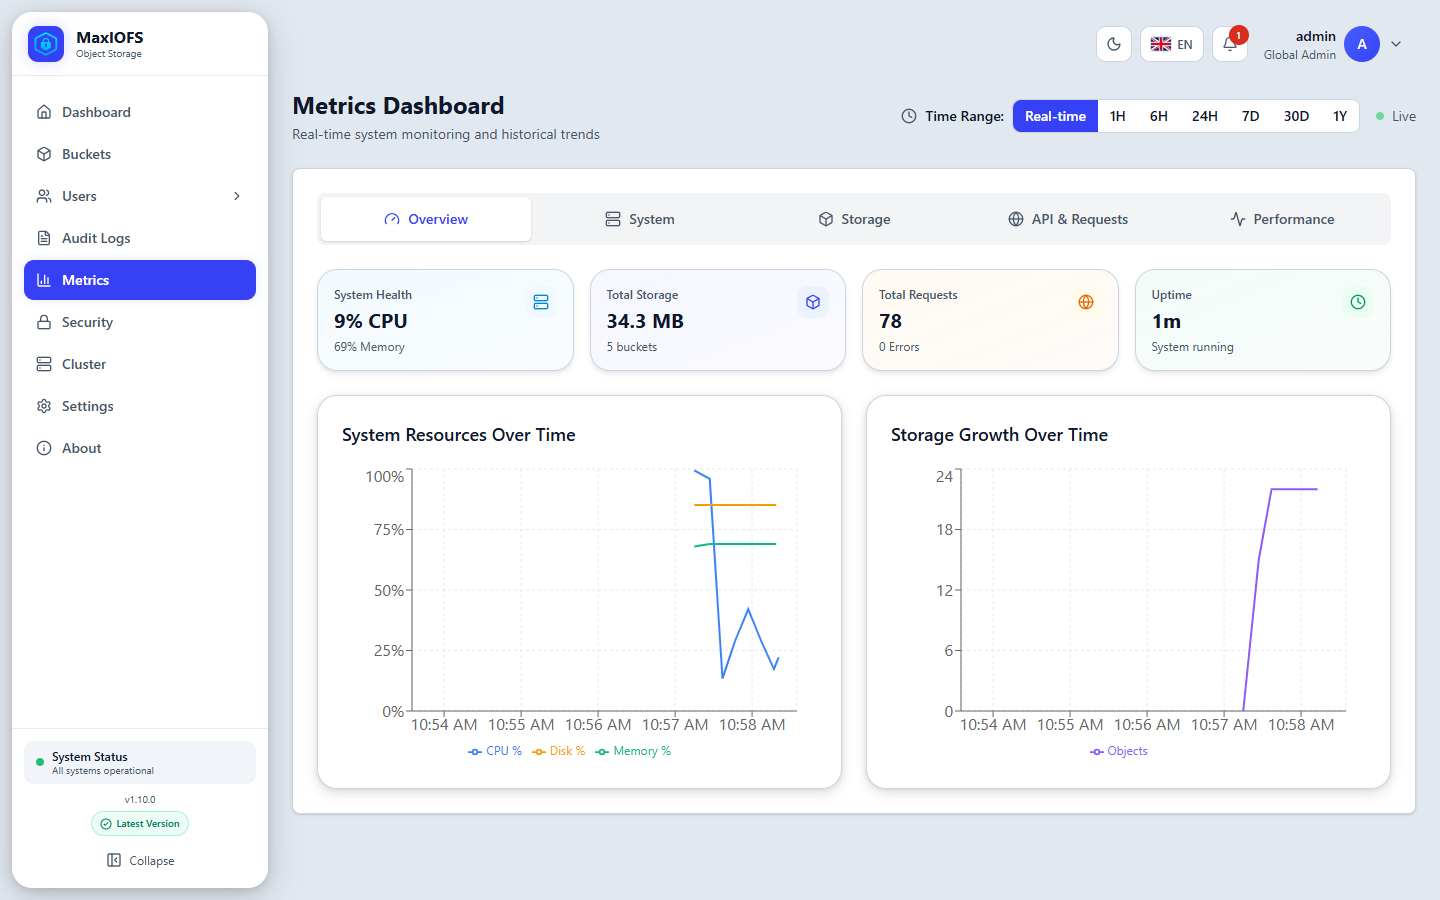
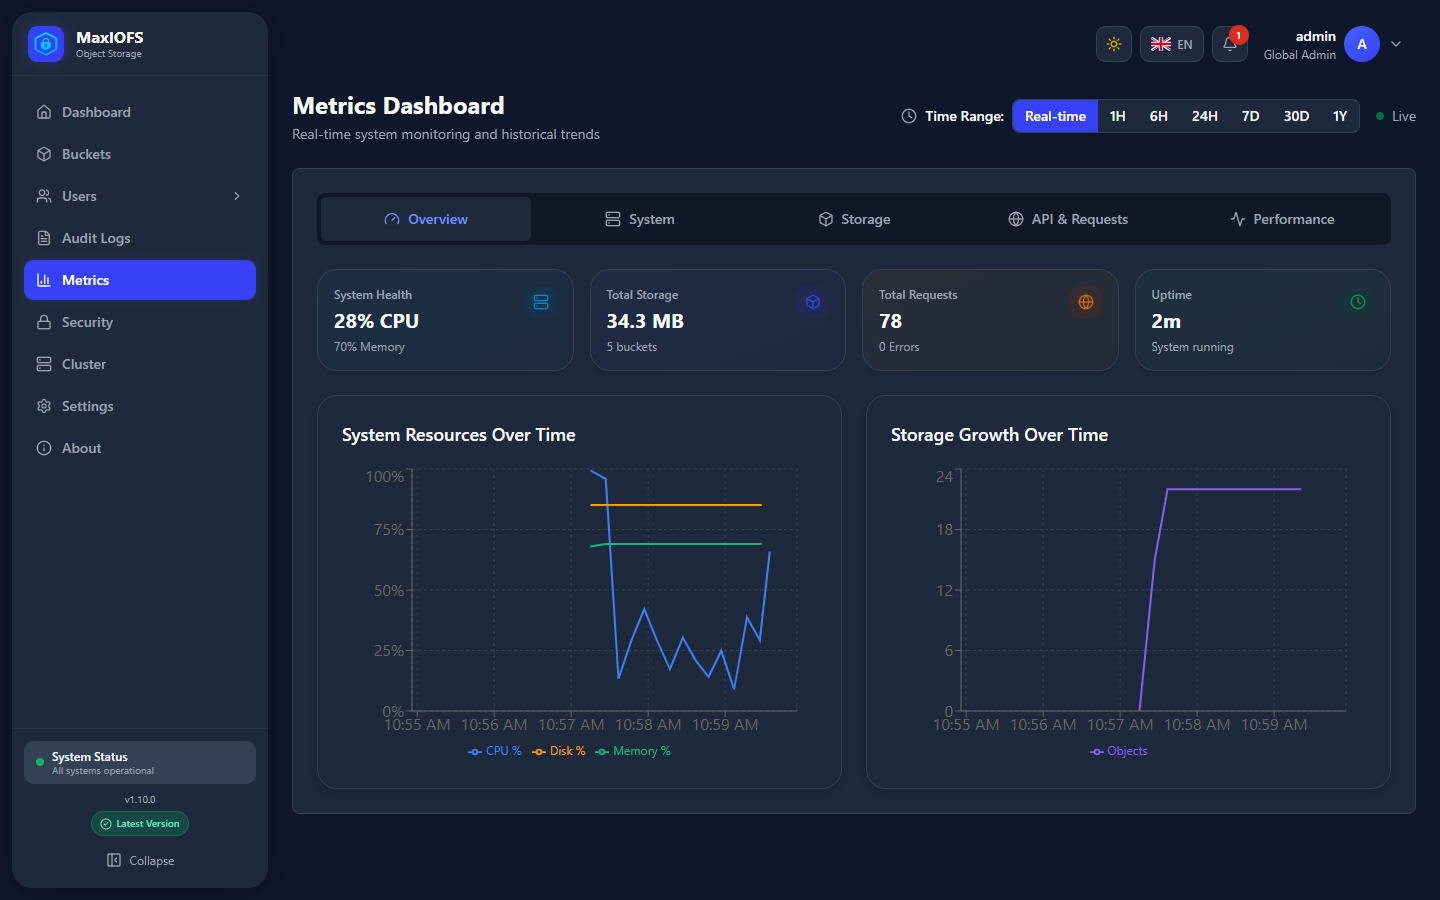
| Tab | Charts |
|---|---|
| Overview | System resources and storage growth over time, uptime |
| System | CPU and memory, disk use, goroutines and heap memory over time |
| Storage | Objects and bytes over time, number of buckets, average object size |
| API & Requests | Requests, errors, success rate, latency and throughput |
| Performance | Latency of each operation: p50, p95 and p99 |
For long-term monitoring and alerting, scrape the Prometheus endpoint instead: see Prometheus and Grafana.